

Bitcoin goes up, ETH dips, and Solana consolidates. All crypto coins go through these phases. Or at least the ones with real use cases do. But what do these phases actually mean? And why do coins move like that?
It usually comes down to a key metric: trading volume.
A crypto asset’s trading volume tells how much of it is bought and sold within a given time frame. In this case, it says a lot about its momentum. Volume tells you whether a pump has real demand behind it or if a project is just coasting on hype. It shows you when attention is shifting and when capital is flowing in or bleeding out.
But surface-level volume stats aren’t always enough. If you want to go deeper, to see what’s really happening on-chain, you need better tools like DeFiLlama.
Here’s how to use it to monitor the on-chain trading volume of any coin.
Steps to Monitor On-Chain Trading Volume Using DeFiLlama
Step 1: Go to the DeFiLlama website
- Head over to defillama.com.
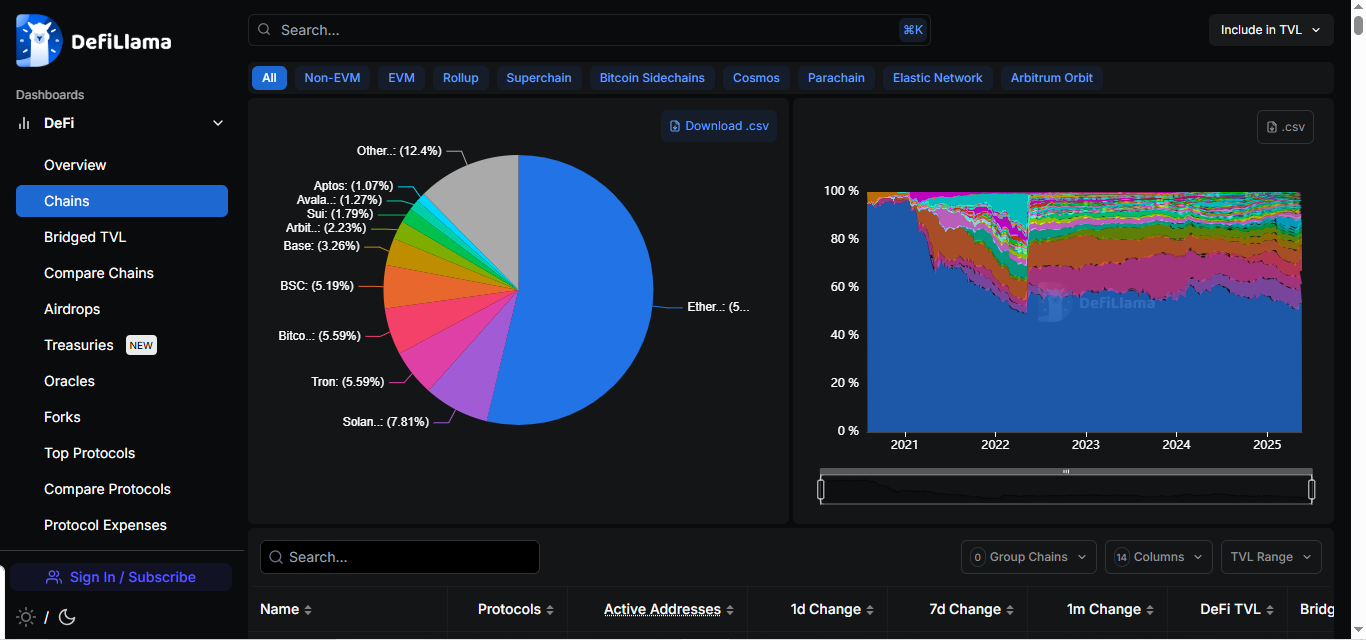
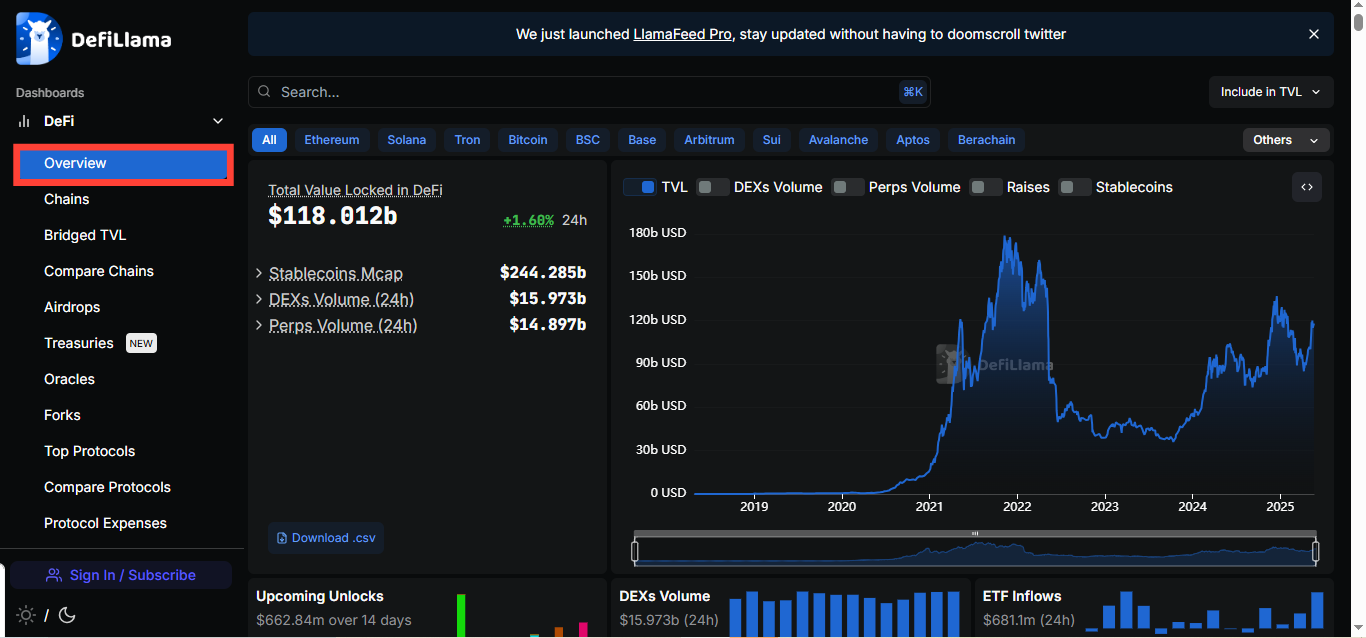
Step 2: Look for the 'Overview' section and tap on it
- On the homepage, you’ll see multiple tabs like “TVL,” “Yields,” “Stablecoins,” etc. For this, stick with Overview or DEX Volume, depending on what you’re tracking.
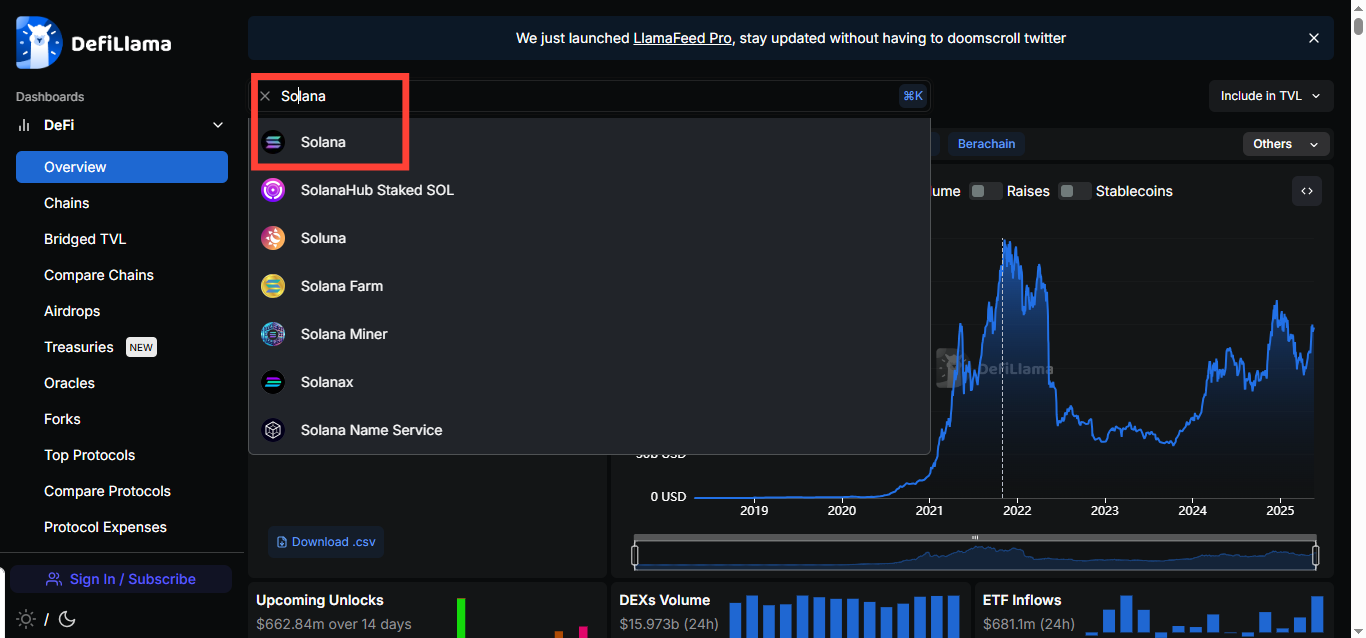
Step 3: Use the search bar to find a specific coin
- At the top, there’s a search bar. Type in the name or ticker of the coin you’re curious about — for example, “SOL” or “AVAX.” It will pull up the relevant protocols or DEXs associated with that asset.
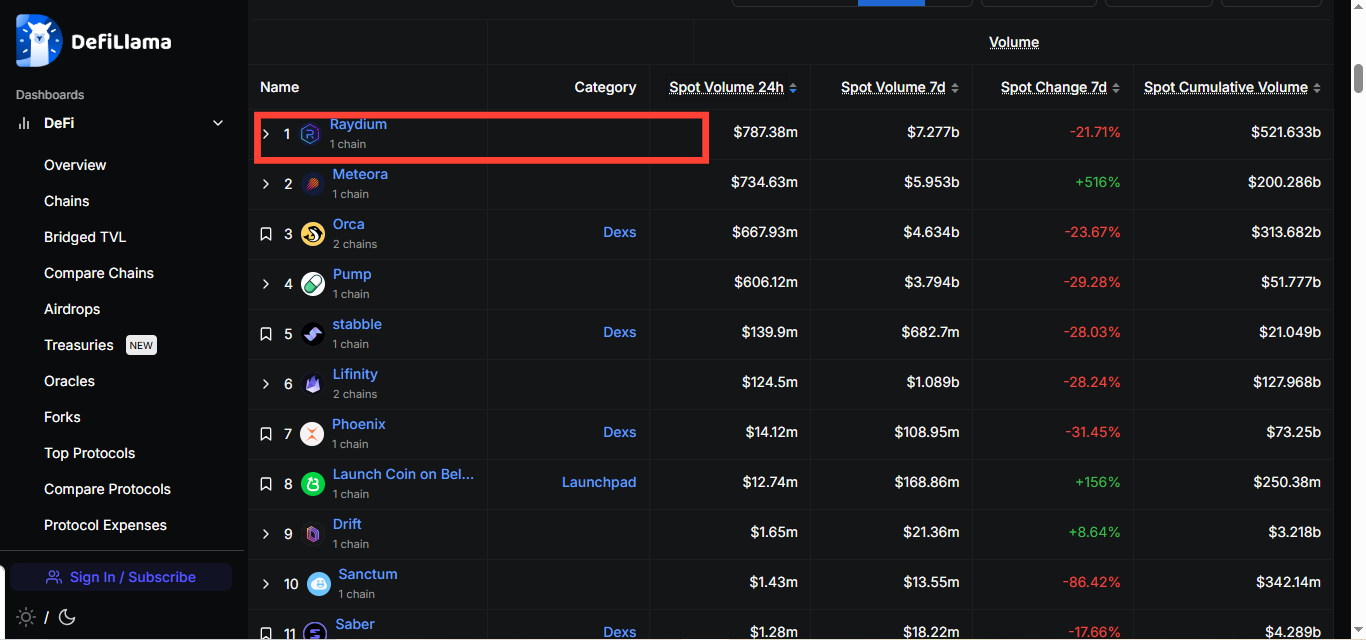
Step 4: Scroll down and click into a protocol or DEX that supports your chosen coin
- Let’s say you’re looking at Solana. You’ll probably find DEXs like Orca or Raydium. Click into one of them to see detailed volume data, including daily, weekly, and monthly on-chain trading activity.
Step 5: Check the Volume charts
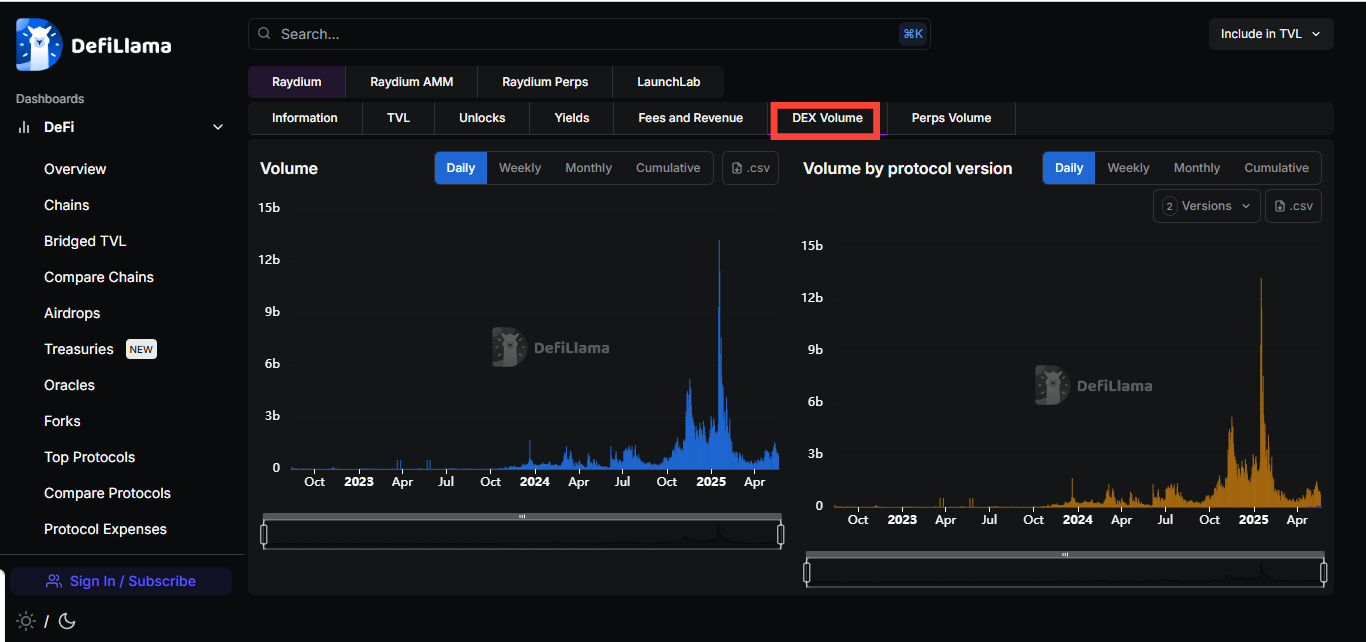
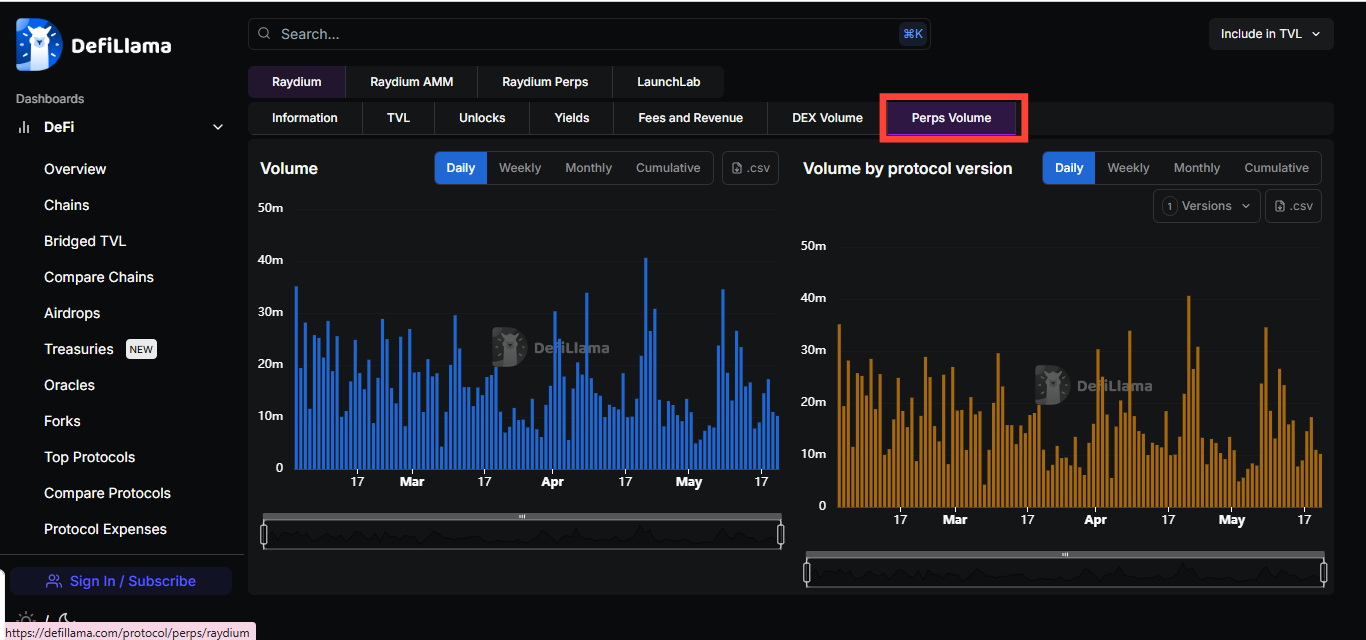
- Once inside, click on DEX volume or Perps volume, depending on the on-chain volume metric you are looking for. You’ll see graphs showing daily trading volume, weekly, monthly, and cumulative. The volume section is what you want, that tells you how much trading is happening on-chain for that coin.
Video Script & Editing: Kelechi Edeh / Techloy.com | Content Research: David Adubiina / Techloy.com
Conclusion
Overall, it is important to note that most coins don’t live on just one chain or trade on a single DEX (decentralized exchange). If you’re tracking something like USDC or ETH, which move across multiple blockchains and platforms, it’s important to check their volume on all the major DEXs where they trade. That way, you get the full picture of how active they really are on-chain.
DeFiLlama makes this easy by letting you switch between chains and toggle views—just make sure you’re looking at the Volume section, not just TVL, when you want trading activity. If it feels a bit overwhelming at first, don't worry. Stick with the Volume view on one protocol or DEX to start. Once you get comfortable, you’ll see how powerful this tool is for reading the real pulse of a crypto coin.
Image credit: David Adubiina/Techloy.com


